Getting Started with TradingView Advanced Charts
This post covers integrating TradingView Advanced Charts into a web project.
Applying for Access
TradingView Advanced Charts is free to use, but you need to request access to the library through the official website. Use a company email address when applying. In my experience, a reply arrived within a week. Follow the instructions in the email, complete and sign the agreement, and send it back. Make sure the email address in the agreement matches the one used for the application.
Usage
Setting up the TradingView widget involves three steps:
- Download the library from the project repository and place it in your project's public directory, usually
public. - Add
<div id="tv_chart_container"></div>to the DOM. - Initialize
tvWidget.
window.tvWidget = new TradingView.widget({
    library_path: "path_to_charting_library",
	locale: 'en',
	container: 'tv-chart-container',
	autosize: true,
	interval: '1', // 1 minute
	favorites: {
		intervals: ['1', '15', '1D'],
	},
	allow_symbol_change: false,
	theme: 'light',
    symbol: `EXCHANGE:BTC/USDT`, // default pair
    timezone: Intl.DateTimeFormat().resolvedOptions().timeZone,
	disabled_features: [...],
	enabled_features: [...],
	custom_themes: {
		light: [...],
		dark: [...]
	},
    datafeed: ...,
});
Set autosize to true to make the widget fill its parent container. You then only need to define the parent's dimensions.
Set timezone to Intl.DateTimeFormat().resolvedOptions().timeZone to display times in the user's time zone.
Use disabled_features and enabled_features to choose which features are available. For example, configure these when you need to hide parts of the UI. See the featureset documentation for the available options. Here is my configuration:
disabled_features: [
    'symbol_search_hot_key',
    'header_quick_search',
    'header_symbol_search',
    'header_compare',
    'header_settings',
    'header_undo_redo',
    'header_saveload',
    'items_favoriting',
    'symbol_search_hot_key',
    'symbol_info',
    'edit_buttons_in_legend',
    'delete_button_in_legend',
    'use_localstorage_for_settings',
    'create_volume_indicator_by_default',
    'popup_hints',
],
enabled_features: ['show_interval_dialog_on_key_press', 'items_favoriting'],
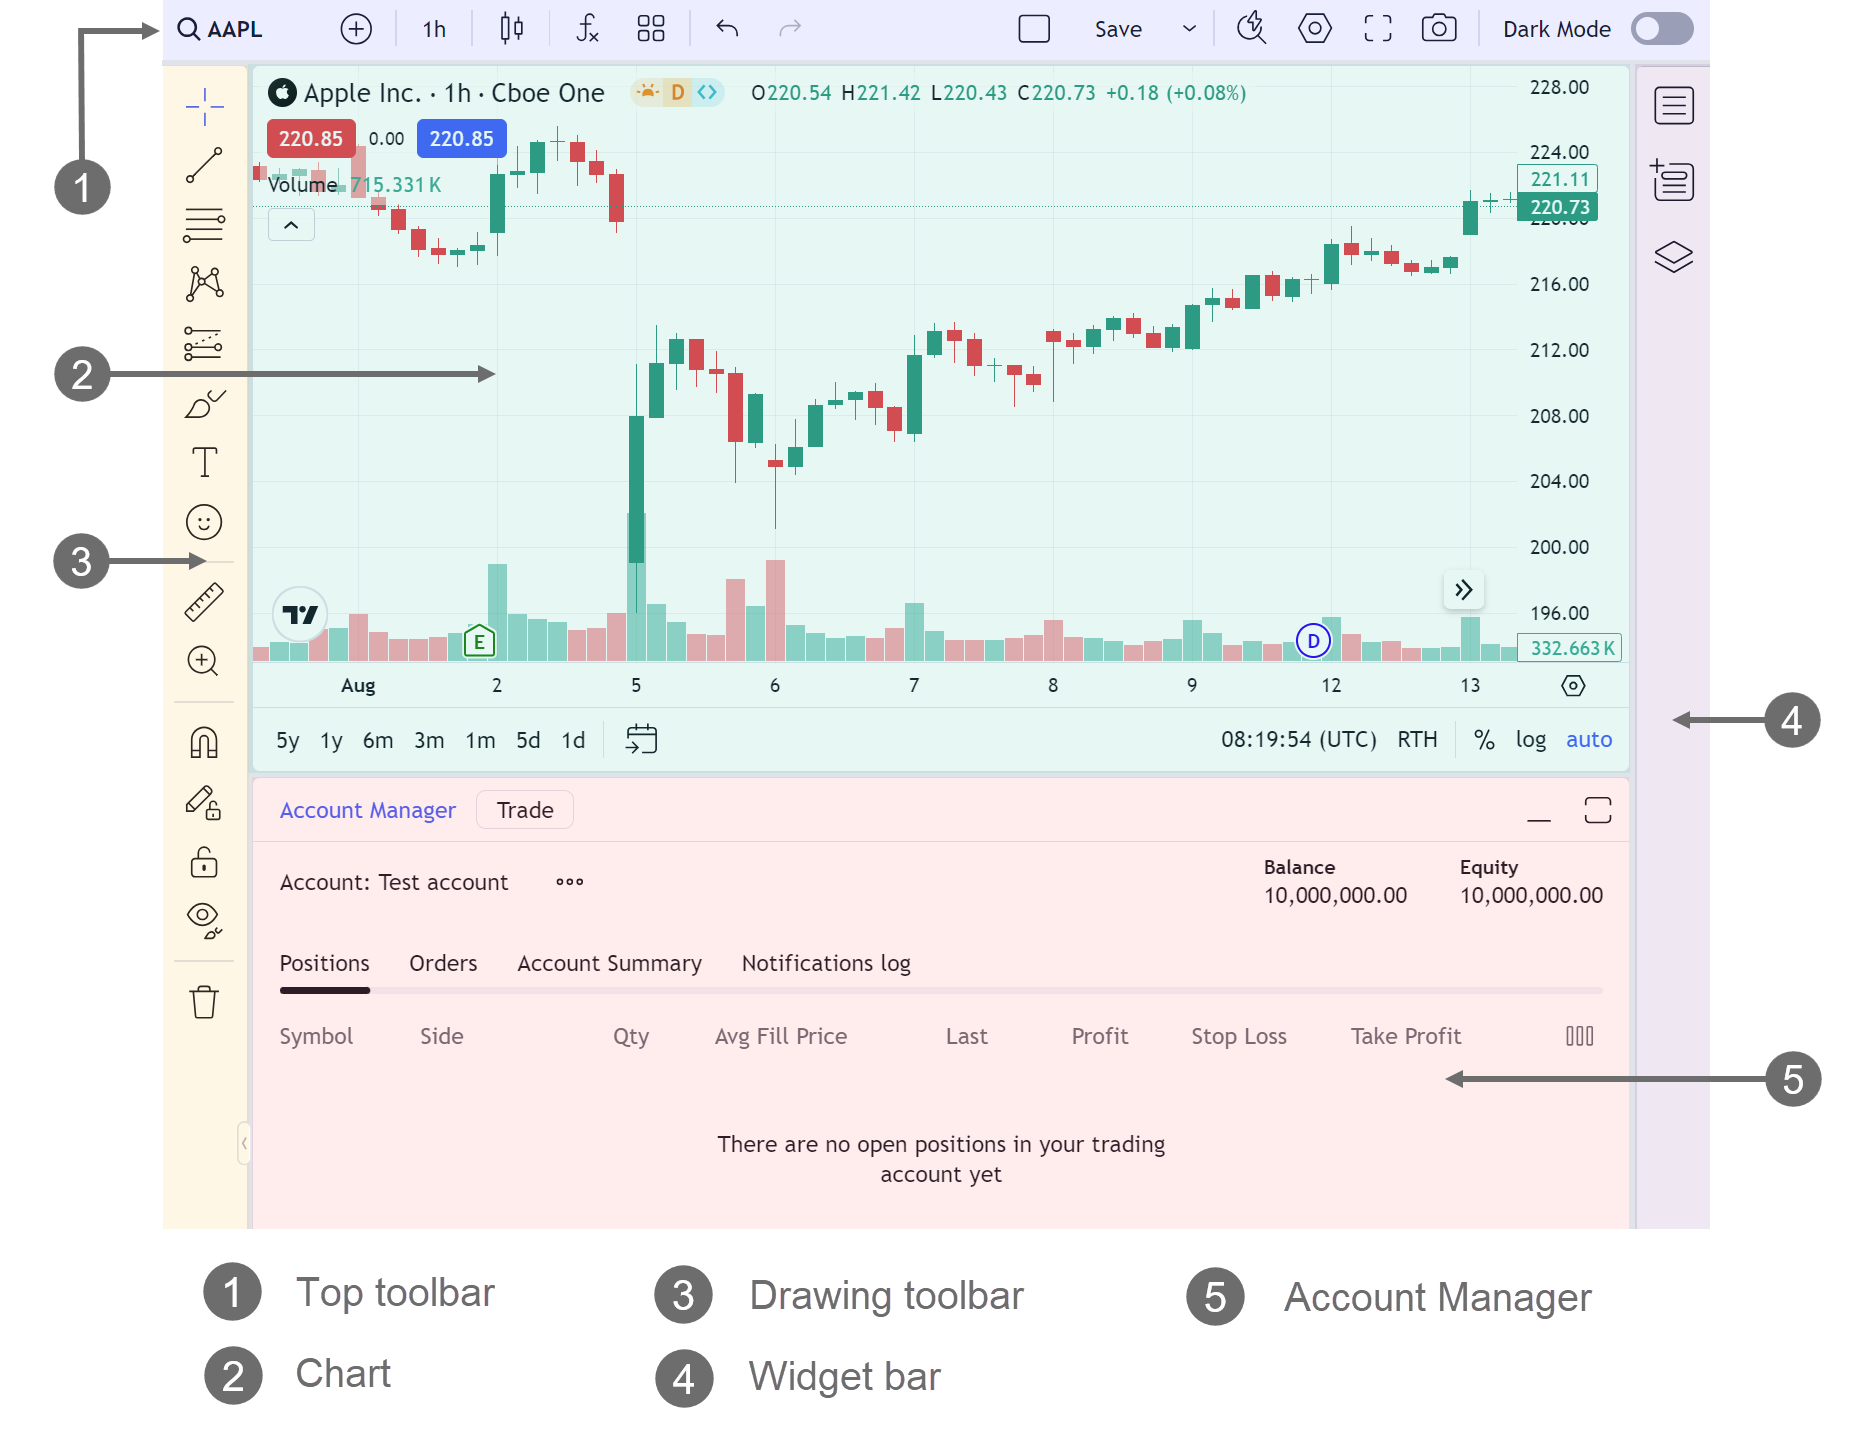
Use the following diagram to find the names of UI elements:
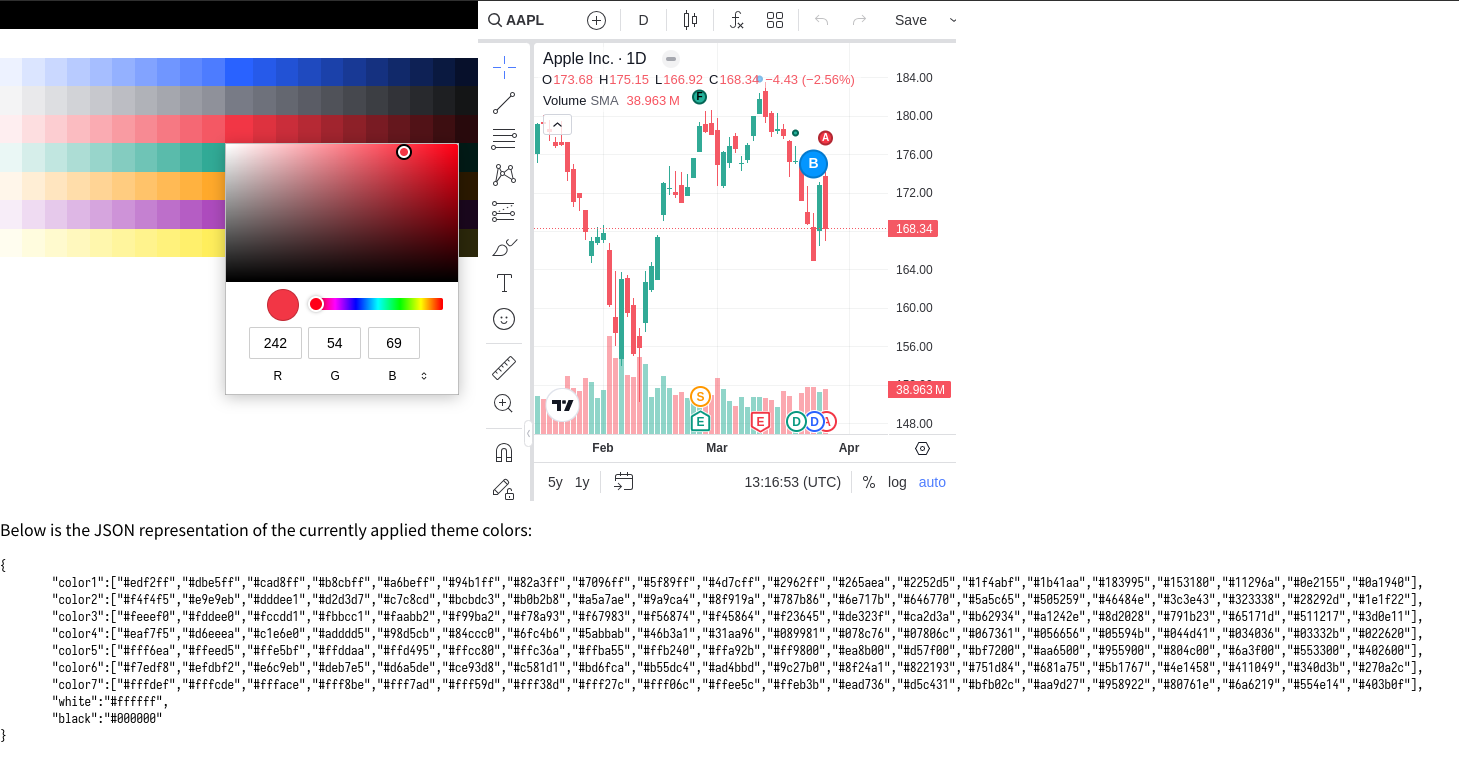
custom_themes defines the themes. Usually, you will configure both a light theme and a dark theme.
The theme includes nine colors: color1, color2, color3, color4, color5, color6, color7, white, and black. color1 is the primary color, color3 is red, and color4 is green. You can configure a theme in this editor and copy it into your project.
The remaining option, datafeed, is the most important part. It provides the following methods; see the datafeed API documentation.
interface Datafeed {
	onReady(callback: OnReadyCallback) => void;
	searchSymbol(
      userInput: string,
      exchange: string,
      symbolType: string,
      onResult: SearchSymbolsCallback,
	) => Promise<void>;
    resolveSymbol(
      symbolName: string,
      onResolve: ResolveCallback,
      onError: DatafeedErrorCallback,
      extension?: SymbolResolveExtension,
    ) => Promise<void>;
    getBars(
      symbolInfo: LibrarySymbolInfo,
      resolution: ResolutionString,
      periodParams: PeriodParams,
      onResult: HistoryCallback,
      onError: DatafeedErrorCallback,
    ) => Promise<void>;
	subscribeBars(
      symbolInfo: LibrarySymbolInfo,
      resolution: ResolutionString,
      onTick: SubscribeBarsCallback,
      listenerGuid: string,
	  onResetCacheNeededCallback: () => void,
    ) => Promise<void>;
	unsubscribeBars(subscriberUID: string) => void
}
onReady runs when the chart initializes. Use its callback to provide the basic configuration.
searchSymbol searches for symbols based on the user's input.
resolveSymbol provides information about a symbol.
const symbolInfo = {
    ticker: 'BTCUSD',
    name: 'BTCUSD',
    description: 'Bitcoin/USD',
    type: symbolItem.type,
    session: '24x7',
    timezone: 'Etc/UTC',
    exchange: 'Example Exchange',
    minmov: 1,
    pricescale: 100,
    has_intraday: false,
    visible_plots_set: 'ohlcv',
    has_weekly_and_monthly: false,
    supported_resolutions: ['1', '5', '30', '60', '1D', '1W'],
    volume_precision: 2,
    data_status: 'streaming',
};
getBars retrieves historical data.
subscribeBars delivers new data updates.
unsubscribeBars is called to remove a subscription when the chart changes symbols.